Fminbnd
From DDL Wiki
| Line 19: | Line 19: | ||
In this output, the value of f is the value of the function at the optimum. Likewise, x is the point at which the minimum occurs. | In this output, the value of f is the value of the function at the optimum. Likewise, x is the point at which the minimum occurs. | ||
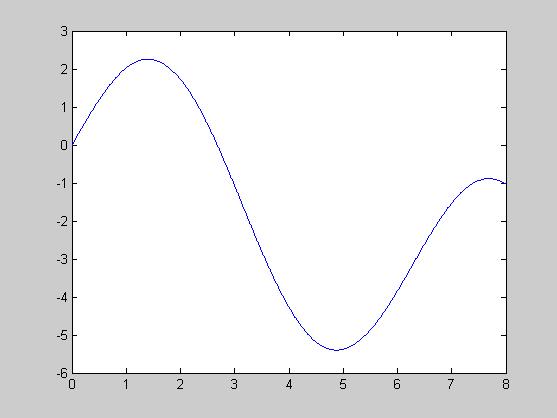
This result may be verified by plotting the function. Doing so produces the following plot which appears to match the result by fminbnd: | This result may be verified by plotting the function. Doing so produces the following plot which appears to match the result by fminbnd: | ||
| + | |||
| + | |||
[[Image:fminbnd_pic.jpg]] | [[Image:fminbnd_pic.jpg]] | ||
Revision as of 23:34, 8 December 2006
fminbnd is an optimization function built into Matlab that is used for solving one dimensional, constrained optimizations.
Running an optimization using the fminbnd function requires several steps. First, one needs the function being analyzed, and the optimization constraints. As an example the function f(x) = 3*sin(x)-x/2 will be analyzed over the range of 0<=x<=2.
An M-file must be created to store the function. This file must be saved in the current directory as fx.m.
  function f=fx(x)
  f = 3*sin(x)-x/2
The function must then be implemented. This is done through the following command and output as follows:
>> x=fminbnd(‘fx’,0,8)
f = -5.3980
x = 4.8798
In this output, the value of f is the value of the function at the optimum. Likewise, x is the point at which the minimum occurs. This result may be verified by plotting the function. Doing so produces the following plot which appears to match the result by fminbnd:

