Ratcheting Screwdriver Redesign
From DDL Wiki
Contents |
Market Research
Project Schedule
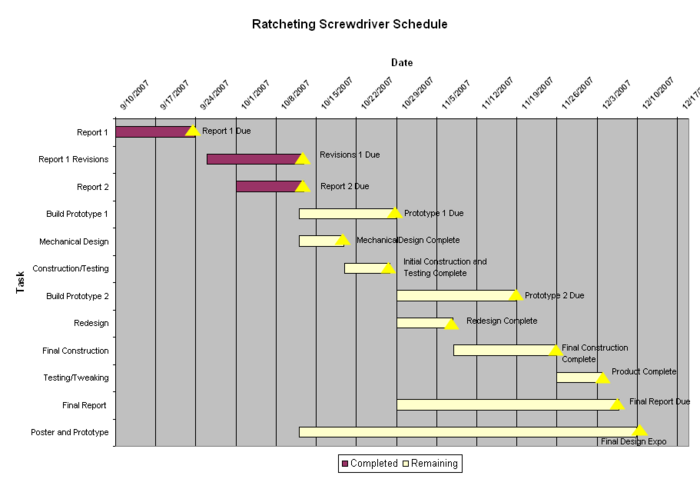
The schedule for the remaining part of the project is layed out in the Gantt chart below. The milestones' occurences are denoted by a yellow triangle and have a breif description next to them. The big milestones will be the completion of Prototype 1 and Prototype 2, the Final Report, and the Design Expo. The chart is in one week increments with the red parts of the bar denoting the parts of teach task that have been completed and the cream-colored yellow represents the time remaining to complete the task.

