Bike pump opportunity
From DDL Wiki
(→Pugh Chart) |
(→Pugh Chart) |
||
| Line 153: | Line 153: | ||
Description of what to include: Identify relevant competitor products from your patent searches, commercial searches, web searches and expert interviews. Compare pros and cons of each of your concepts on a standard Pugh Chart against your top stakeholder needs, and benchmark against the most relevant competitors. If your concepts are better on some attributes and worse on others, identify any market segments likely to value the tradeoffs you can offer. | Description of what to include: Identify relevant competitor products from your patent searches, commercial searches, web searches and expert interviews. Compare pros and cons of each of your concepts on a standard Pugh Chart against your top stakeholder needs, and benchmark against the most relevant competitors. If your concepts are better on some attributes and worse on others, identify any market segments likely to value the tradeoffs you can offer. | ||
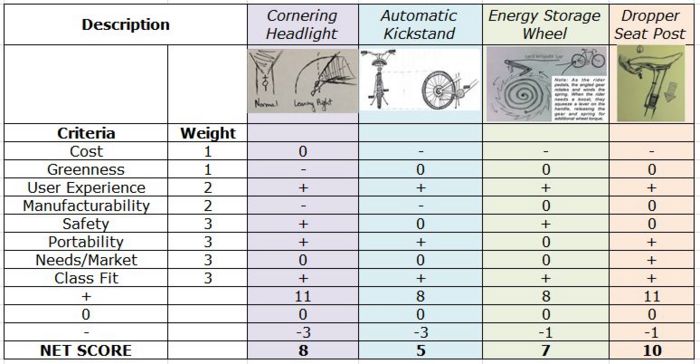
| - | Below is a Pugh Chart comparing our top 4 design concept ideas | + | Below is a Pugh Chart comparing our top 4 design concept ideas and the scoring system that was used to narrow down our ideas to a single selection. In using this scoring system, we had entirely original ideas and therefore could not compare them to a standard product. Additionally, all of our ideas stem from identified product stakeholder needs and have a big variety as to what problem they attempt to solve. |
| + | |||
| + | |||
| + | [[Image:pugh.jpeg|thumb|700px|center|Figure x: Pugh Chart]] | ||
==Gantt Chart== | ==Gantt Chart== | ||
Revision as of 02:39, 8 October 2012
Contents |
Executive Summary
Describe key findings and recommendations. In particular, identify which concept you recommend pursuing for the remainder of the semester. Provice a hypothetical user scenario representative of your target market from your research findings to motivate your top solution concept.
Market Research
Our group used a variety of means to perform market research to understand and brainstorm potential design projects for Phase III. The following are details about each aspect of our market research.
Pittsburgh Critical Mass
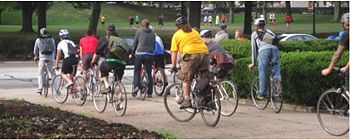
Critical Mass is an event that occurs on the last Friday of every month celebrating alternative forms of transportation. In a mass of bicycle riders, the goal is to remind people that bikes are an efficient means of transport and deserve a place on the road ("Pittsburgh Critical Mass").
Critical Mass provided our group opportunity to interact and observe a large collection of bike riders in the area who are serious and passionate about bicycling and bicycles. The atmosphere of Critical Mass is supportive and communal, so every rider we talked to was very ready to answer our questions.
Critical Mass provided our group with easy access to observe many bike riders and the opportunity to interview those same bike riders for information regarding their preferences and opinions about necessary and lacking bike accessories.
User Interview
Before the bike ride began, we interviewed a few local Pittsburgh bikers. We mainly asked bikers what accessories it was that they thought were most needed or lacking in the market. The main responses were a GoPro-style iPhone mount or a cheap dropper post seat (idea below in Design Concepts).
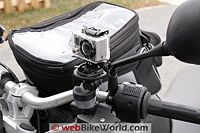
The GoPro Camera Mount pictured is a camera-mounting system for a bike. It allows for the provided camera to be safely and securely mounted to allow for wide-angle photos to be captured while riding a bike. The purpose of having a GoPro-style iPhone mount would be to allow for users to safely and securely mount an iPhone to their bike handlebars and use their phone as a camera. Reliability would be of utmost importance when designing and manufacturing a product such as this because consumers would want to rest assured that their expensive iPhone would not be at any risk to fall off of the mount while the user is on a bike ride, thus causing possible irreparable damage to the phone.
User Observations
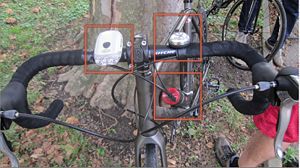
After talking to a few of the bike riders, we watched as the mass rode off to take over the streets in their bikes. Our key observations from Critical Mass show that many bike riders have configured some sort of handlebar flashlight. Additionally, we noticed that about half of the bike riders wore helmets and approximately 30% of riders had some sort of pack. These observations are also important in helping us to identify consumer markets for potential bike products.
Patrick should add more information to this section, please.
Expert Interview
To conduct an expert interview, our group interviewed a mechanic at Free Ride. Free Ride is a bicycle recycling and education facility focused on teaching the do-it-yourself approach to bicycle repair and maintenance. The basic philosophy of Free Ride revolves around the old saying “If you give a person a fish they will eat for one day but if you teach them how to fish they will eat for a lifetime.” Free Ride aims at teaching people how to acquire the skills to keep a bike running and in good working condition, and by completing the Earn-A-Bike program, bike riders can receive a spiffy bike that they have repaired themselves ("Free Ride Pittsburgh").
Our interview with the mechanic from Free Ride provided us with key insight as to the condition of many recycled bicycles and hand-made accessories.
Survey
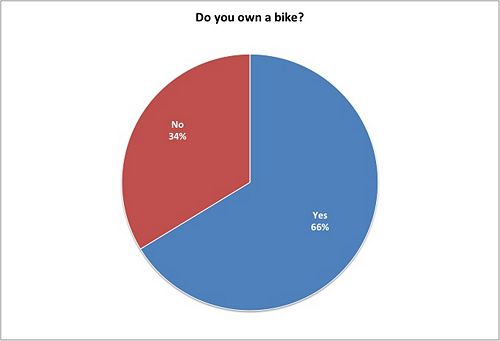
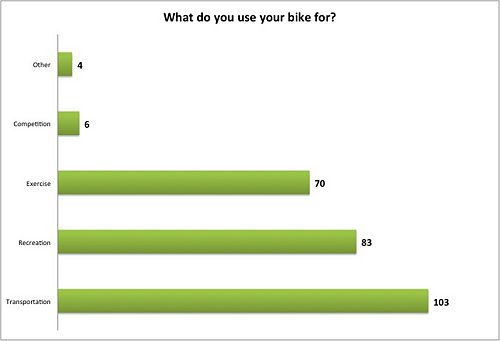
In order to gain more information from bike users regarding bike use, accessory use, modification of accessories and key features for which bike users look for in a bike, we sent out an online survey to friends. We received 187 responses back from predominantly college students. Of those 187 responses, 124 participants own a bike and 63 participants do not own a bike. This allowed us to identify that 66% of college students own a bike based on our random sampling. Figures 6-13 show the breakdown of the data gathered from our survey. The survey questions can be found in the Appendix.
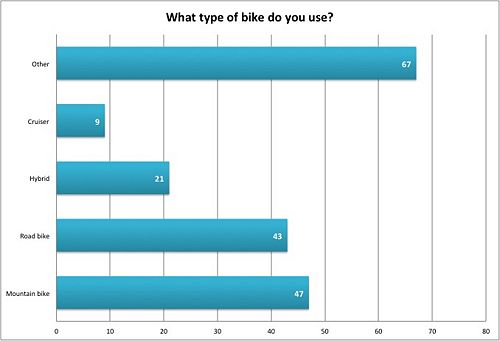
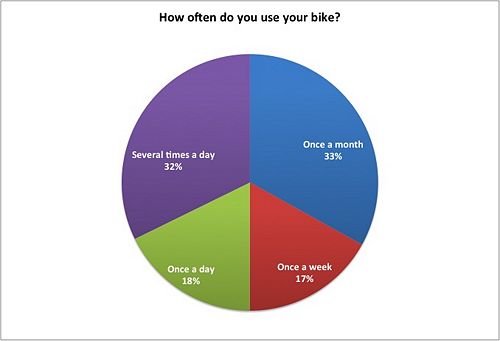
From the data we were able to gather via the survey, in Fig. 7 we can see that most people don't know what kind of bike they ride or do not identify their bike as one of the other options. This information is important because it informed our group that most bike users are not experts when it comes to bikes, and so when they are looking for products in the market, they will focus on simple products that easily identify and provide for their needs. In Fig. 8, our data shows that about half of the bike users ride their bikes at least once a day, with approximately 1/3 of the participants using their bike more than once a day. Because the majority of our survey participants are college students, we assume that these participants are most likely using their bikes to get to and from class.
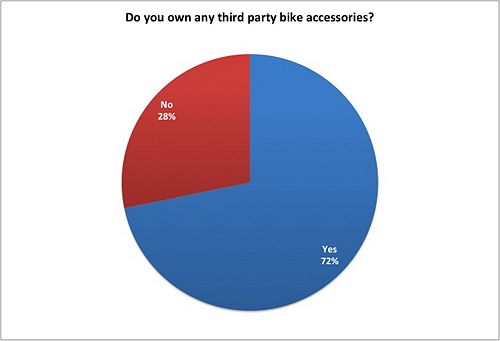
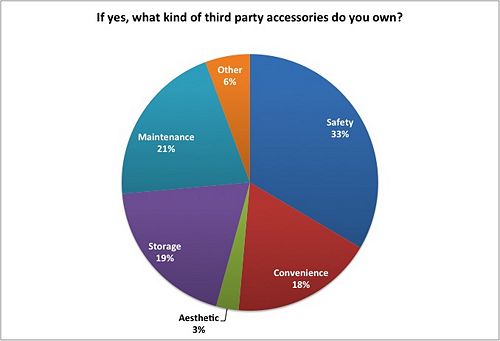
About 70% of bike users in the study do own some sort of bike accessory, as identified in Question 6 and Fig. 10. Fig. 11 shows that about 1/3 of the bike accessories owned are for safety, with other categories varying. In Fig. 12, from the identified free response answers to Question 8 and Question 9, we see that the majority of adapted accessories also pertain to safety and storage. The most identified missing or adapted accessories are listed within the table. However, the most common identified missing accessories (receiving at least 5 of the same free responses) are "Built-in night time safety devices", "Small items/Cup holder" and "Small, portable, modular tool kits". The majority of bike user participants identified the need to have sturdy handlebar lights, a small iPhone or regular bottle holder, or a tool kit that attaches to the bike and allows for the user to pick and choose which tools to take with him/her.
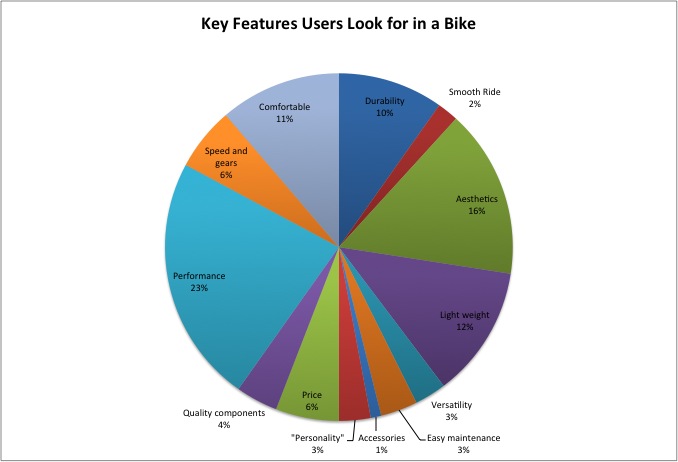
In Fig. 13, we have identified what users are looking for most when purchasing a bike. The mass-majority of responses showed that performance was the main factor when deciding on a bike. Aesthetics and light-weight were the second most important factor. Finally, durability and comfort were the third most important factors.
Product Stakeholder Needs
Question 4 of our survey allowed us to identify our stakeholder's main product needs. The identified stakeholder for this purpose is the bike rider. The needs are those needs that are essential to the bike rider when searching for a bike to encourage the bike rider to make the final purchase.
| Needs | Responses | % of Responses |
|---|---|---|
| Durability | 20 | 10 |
| Smooth Ride | 4 | 2 |
| Aesthetics | 32 | 16 |
| Light weight | 25 | 12 |
| Versatility | 6 | 3 |
| Easy maintenance | 7 | 3 |
| Accessories | 2 | 1 |
| Personality | 6 | 3 |
| Price | 12 | 6 |
| Quality Components | 8 | 4 |
| Performance | 47 | 23 |
| Speed/Gears | 12 | 6 |
| Comfort | 23 | 11 |
While performance is the number one response, it is interesting to note that price was not one of the main contributing factors to purchasing a bike. This shows that bike riders would rather have a bike that effectively meets their needs versus saving money. Purchasing a bike is an investment that users are willing to sacrifice money for more comfort, quality, performance or versatility. We think it is safe to assume that bike riders will also think the same way about a well-produced accessory that effectively meets their needs in terms of the identified stakeholder needs as well.
Design Concepts
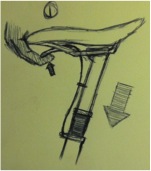
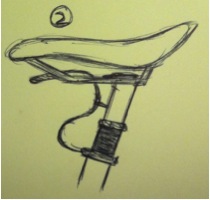
Our top design was the dropper seat post because....
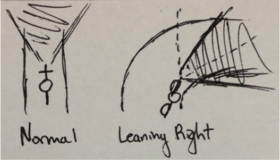
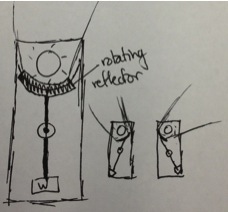
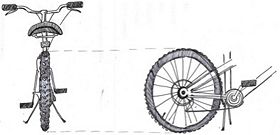
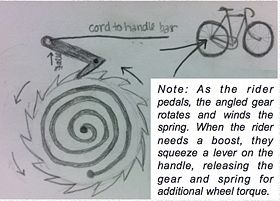
The following four design concepts, after voting, were identified as the most useful and interesting to the group. Within each design concept is a description and sketch, along with potential opportunities for use.
Cornering Headlight
Information about the cornering headlight...
Automatic Kickstand
Information about the automatic kickstand...
Energy Storage Wheel
Information about the energy storage wheel...
Dropper Seat Post
Information about the dropper seat post....
Pugh Chart
Description of what to include: Identify relevant competitor products from your patent searches, commercial searches, web searches and expert interviews. Compare pros and cons of each of your concepts on a standard Pugh Chart against your top stakeholder needs, and benchmark against the most relevant competitors. If your concepts are better on some attributes and worse on others, identify any market segments likely to value the tradeoffs you can offer.
Below is a Pugh Chart comparing our top 4 design concept ideas and the scoring system that was used to narrow down our ideas to a single selection. In using this scoring system, we had entirely original ideas and therefore could not compare them to a standard product. Additionally, all of our ideas stem from identified product stakeholder needs and have a big variety as to what problem they attempt to solve.
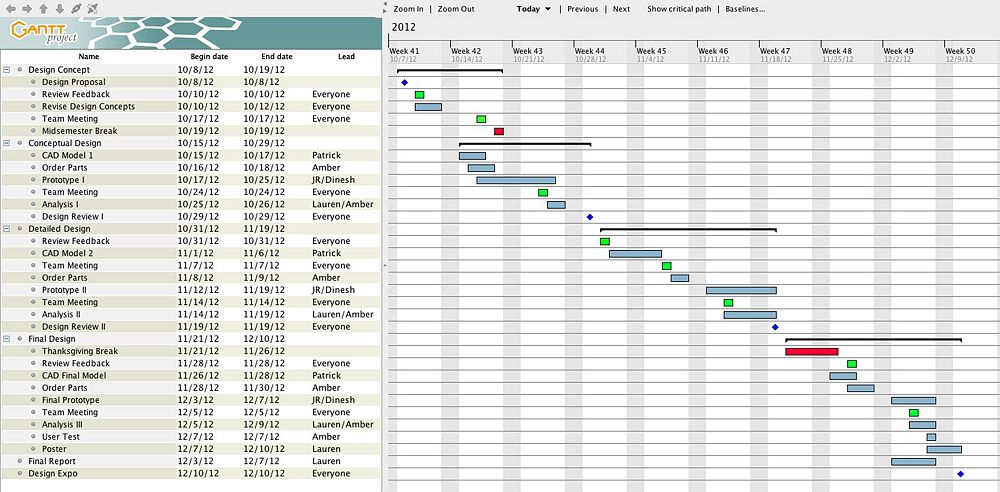
Gantt Chart
Below is a Gantt Chart outlining a detailed plan for the continuation of this project. Included within the chart are are all team meetings and reviews with Professor Michael (in green) and all project milestones (in blue diamonds). These milestones include deadlines for reviews, including class presentations, and the final design exposition. School breaks are included in the schedule because these are times in which the group does not plan on working on the project. These breaks are outlined in red. Finally, each major term of the project is included and then divided into subtasks. The subtasks also include a team leader. These leaders are not responsible or expected to be the only person completing this portion of the project. They are solely the person responsible for scheduling team meetings pertaining to that project section and ensuring that the group is aware of what additional portions of the subtask need to be completed. In this respect, Patrick will lead the CAD modeling efforts. Amber will take the lead in ordering parts for the prototype and for the user test. JR and Dinesh will lead the prototype build efforts. Finally, Lauren will continue to lead the reports and Amber and Lauren will lead the analysis.
Group Dynamic
Brainstorming Lead, Team Leader: Dinesh Ayyappan
Market Research Lead, DFMA Lead: Patrick Hogan
FMEA Lead: Jonathan Wong
DFE Lead: Amber Ohiokpehai
Survey Lead, Wiki Lead: Lauren Milisits
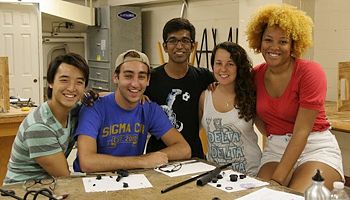
During Phase II, our group continued to work effortlessly together. In this phase, Dinesh and Patrick both attended Pittsburgh Critical Mass to take pictures and interview various bike riders for the user study. Patrick also made a trip to Free Ride to find a bike mechanic for our expert interview. During a PHIday team meeting, all members of the team helped to brainstorm survey questions while JR compiled, formatted and created the actual survey to send out via an easily accessible link. Once the survey results were gathered, Lauren compiled and analyzed the free responses, while creating visuals and graphs. All team members brainstormed 10 ideas before the brainstorming class lecture, giving us 50 possible ideas. During the brainstorming session in class, all team members were present and actively participatory in the round-robin session. All members met up again to categorize and vote on possible top ideas before a team meeting with Prof. Michalek. Finally, the majority of the team met for a final brainstorming session. Dinesh took the lead in creating a powerpoint to present to the class during Monday's lecture, and Lauren took the lead to create the majority of the Wiki page, with various team members contributing to sections of their expertise. Dinesh remained the team leader because it provides him with more opportunity for growth in developing his teaching and organizational abilities. Additionally, our group has a well-established and happy dynamic, and although all members would be happy and capable of leading the team, Dinesh enjoys taking detailed notes and sending out emails.
References
"Free Ride Pittsburgh". Free Ride Pittsburgh Home. N,p., n.d. Web. 07 Oct 2012. <http://www.freeridepgh.org/>.
"GanttProject: Free Desktop Project Management Tool." GanttProject: Free Desktop Project Management Tool. N.p., n.d. Web. 08 Oct. 2012. <http://www.ganttproject.biz/>.
"Pittsburgh Critical Mass". Pittsburgh Critical Mass Home. N.p., n.d. Web. 07 Oct. 2012. <http://www.pghcriticalmass.org/>.
Appendix
Survey Questionnaire
| Bike Accessory Question | ||
|---|---|---|
| Question | Answers | |
| 1 |
Do you own a bike? |
|
| 2 |
What kind of bike do you use? |
|
| 3 |
How often do you use your bike? |
|
| 4 |
What do you look for in a bike? |
Free response section |
| 5 |
What do you use your bike for? |
|
| 6 |
Do you own any third party bike accessories? |
|
| 7 |
If you answered "Yes" to Question 5, what kind? |
|
| 8 |
If you have adapted/created any accessories for your need, please explain. |
Free response section |
| 9 |
What bike accessories do you think are missing from the market or are currently inadequate? |
Free response section |
Brainstorming Technique
Our group utilized various brainstorming techniques to come up with 100 ideas. Our first brainstorming technique required that each group member brainstorm 10 original ideas without communicating to the other members of the team. This ensured that no member was influenced by the other teammates and the group could come up with a variety of unique ideas. In doing so, members who had much experience with bikes (Amber and Patrick) were able to brainstorm safety and storage ideas. Dinesh and JR, who still had experience with bikes, brainstormed many possibly useful ideas for adapting preexisting bike accessories and safety functions. Lauren, who has no experience with bikes (but does know how to ride one) brainstormed more creative and unique ideas. With these 50 ideas prepared before the round-robin session during class, the group was able to have a variety of useful and unique ideas already prepared and able to develop more during the class brainstorming session.
The second technique for brainstorming was the round-robin session. In this session, each team member identified one of their original 10 ideas and displayed the idea drawn on a Post-It for all other team members to see. In this way, our group was able to quickly communicate and share the 50 ideas and to start sparking new thoughts. Next, each team member identified a few of their favorite ideas from the original list of 10 and drew them on paper. After five minutes, teammates passed their paper to the right, and for the next five minutes identified possible pros/cons with the new sheet of ideas in front of them and added on to that paper. We passed our papers a third time. This brainstorming technique allowed for us to quickly identify possible questions of feasibility with some of the brainstormed ideas, but also allowed for group members to add on to the original idea.
Finally, our group got together for a third and final brainstorming session and voted on the ideas to identify a few top ideas. After voting on some ideas, each member was able to brainstorm 10 more unique ideas to give a final 100 possible ideas.
100 Brainstorming Ideas
| 100 Brainstorming Ideas | ||||
|---|---|---|---|---|
| Safety (10) | Convenience (15) | Storage (30) | Aesthetic (25) | Other (20) |
|
|
|
|
|
