Umbrella Traffic Flow Analysis
From DDL Wiki
Contents |
Executive Summary
The most important aspects of implementing this umbrella distribution system are determining where to place the distribution units and determining how many units to place at each location. We looked at campus traffic flow to determine how many units to place. This was done using two methods: a simulation of traffic flow, and counting the number of people going into and out of each major doorway on campus.
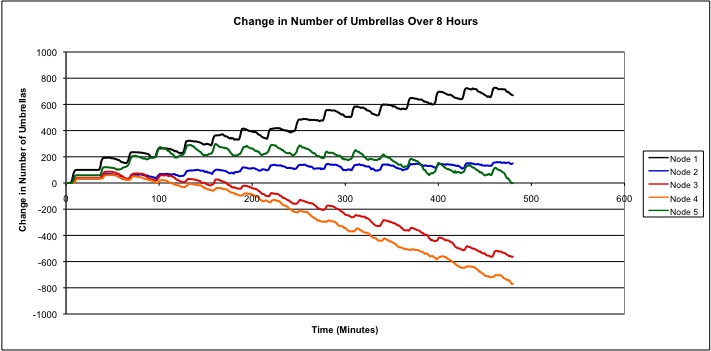
Our simulation of traffic flow was done using a Markov chain simulation. Even with a functional model, we could not get the type of data that would be necessary to achieve actual campus traffic numbers because we could not determine movement probabilities. However, it did show us that traffic tends to move sinusoidally, with a large outflow as classes let out followed by a large influx as people arrive from elsewhere on campus. The model would have been more useful if we could determine actual movement probabilities, but determining those is prohibitively time consuming.
To ballpark our umbrella needs at each location, we sat outside the major campus doorways and counted people going into and out of buildings. We found that the most heavily trafficked doorway is the upper doorway at Doherty Hall. It will need to have the largest capacity of any of the locations in the system.
Our main conclusion is that it is very difficult to gain an accurate understanding of traffic flow around campus. A better approach than spending the time to create a model or count people is to have each unit calculate the average time that an umbrella spends within the unit, and to move units from locations with a high average time to locations with a low average time to balance distribution around campus. Our ultimate solution is to overpopulate the umbrella system and remove units as needed. With a low unit price, this should be easier than the complex analysis necessary to get a perfect result.
We will also have to observe the system to ensure that sinks and sources are not developing; that is, the stock of umbrellas at any location is roughly constant. If the system develops a consistent surplus of umbrellas in one location and a shortage in another, the umbrellas may have to be manually moved around, which is labor intensive and potentially costly.
Purpose
The physical construction of our device is relatively simple. It contains few components, and those components are already well-developed and commonly used. The size of the device is constrained by the umbrellas, and device weight is not a large concern since it will be stationary. Given this, we did not feel that a strictly mechanical analysis would provide us the insight that we need to develop a complete solution. In addition to the design of the hardware, the issue of implementing the system had to be addressed. This is where we chose to focus our analysis. The largest issue of implementation is determining where to place the units, and how many modular units to put at each location. Traffic flow into and out of each doorway is the major determinant of this, so we decided to find out what the traffic flow was like as a function of time at the major doorways on campus. By determining the flow rate and difference in number of umbrellas at each location we can determine the number of umbrellas needed at each location for a given time, and the speed at which these umbrellas need to dry in order to be ready for reuse. Based on these parameters we can finalize our system design and determine the number of units needed, allowing us to determine the system cost and ultimately its feasibility.
Approach
Finding the traffic flux at the major doorways was done using two different methods.
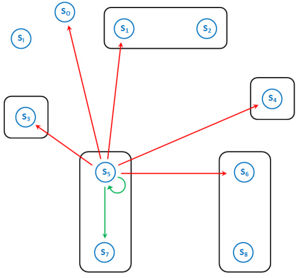
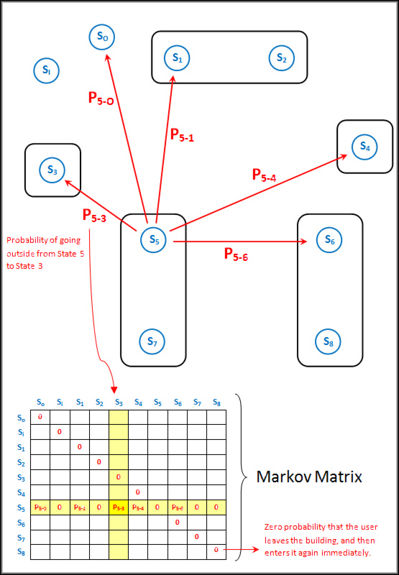
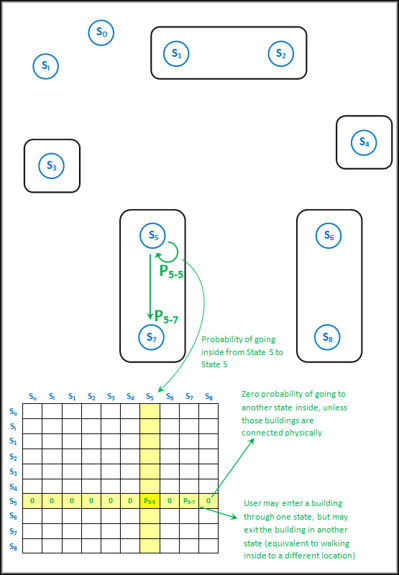
The first method is a Markov simulation of traffic flow around campus. A Markov matrix expresses the probability that something in a given state at some time will move to another given state at the next time. In our model, it expresses the probability that somebody leaving a certain doorway will move to another given doorway. Two matrices are needed for our model because the probabilities of where users are going to move are different for users entering and leaving a given doorway. For example, a user exiting the upper door of Baker hall might go to the library, the UC, or some other building. A user entering the same door must exit through either the same door, the lower door at Porter hall, or one of the other doors along the length of the building. Using these movement probabilities, a model of campus was constructed and a rainy day was simulated to see how traffic moved around campus.
Unfortunately, an accurate model of the campus would require large amounts of data averaged over a large time span, which was not feasible for us to collect within the given time frame of this project, and may not be feasible for other clients to collect. To estimate the necessary capacity of the system without using a full model simulation, we counted traffic flow in and out of major doorways in half- to one-hour increments. This gives us point estimates of traffic flux, allowing us to see roughly which doorways would need more units.
Model
Assumptions
1. It is constantly raining throughout the model day.
- In real life there are an infinite number of combinations that could be made to represent the raining portions of the day. In order to represent all of these combinations we would have to introduce unnecessary complexity into our model which would be unjustified at this stage.
2. The Markov movement probabilities are time-independent.
- Human behavior is not fundamentally time invariant, but it would be impossible to accurately model this behavior without extensive testing. Therefore, this assumption will be adequate for a first pass analysis.
3. The probability of taking an umbrella is equal for all users.
- This assumption is accurate due to our large sample size. Over this sample size any variation in umbrella use will be diluted, resolving any need to take data concerning use variation.
4. Movement times are assumed to be normally distributed.
- By allowing variation in traveling times, we are more accurately modeling the walking behavior of people. A normal distribution is justified, since the more exotic, multi-modal distributions would need to be validated through testing.
5. The Markov model is appropriate for modeling behavior.
- For a large system, each individual's choices tend to average out. Over time, the movement probabilities should converge to some set value. Picking a number from this distribution is the best way to simulate a random choice by a user.
6. The movement probabilities are not affected by the existence of the distribution system.
- While movement may be affected by our distribution system it would be impossible to evaluate this effect without extensive testing. As a result this analysis is based on modeling the existing behavior patterns and deploying our system to accommodate those patterns.
Description
After determining the Markov probability matrices, we decided on an algorithm to simulate a day's worth of movement activity.
The simulation steps through each day minute by minute. At each time step, the system can first add new users:
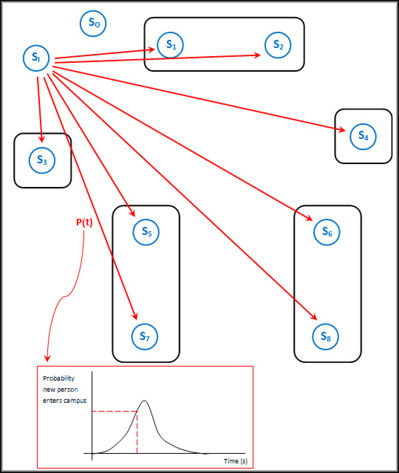
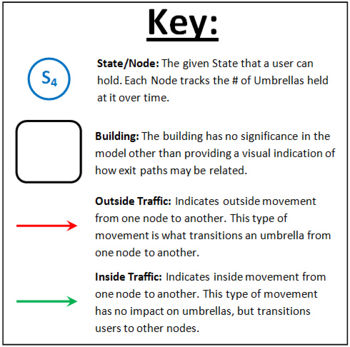
Each user in the system keeps track of its current position, its wait time at that position, whether it is inside or outside, and whether or not it has an umbrella.
Next, it loops through each user. Each user's wait time is reduced by 1. When a user's wait time hits zero, it selects the next location to move to from the appropriate Markov matrix, and its wait time at that location.
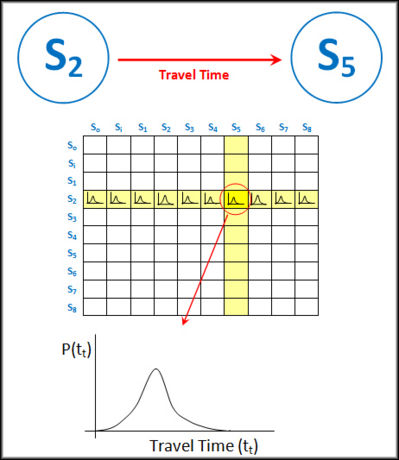
The wait times are selected from a normal distribution given in an Excel file. If the user was inside, and is traveling outside to get to another building, the wait time is given by the distance between the two locations; if a user was outside and is going inside, the wait time is dependent only on the location it has arrived at.
When a user leaves a building, it takes an umbrella, tracked by decrementing an array. When a user enters a building, it deposits an umbrella at the new location, by incrementing an array.
After each user has been dealt with for a given time step, the distribution of umbrellas by location is saved in a large matrix. Once all time steps have been run, the matrix is saved as an Excel file. Plotting the data in the Excel file shows which locations need to keep the largest stock of umbrellas.
Results
As shown in the above figure several nodes gain umbrellas while other nodes lose umbrellas over time. This is due to the imbalanced nature of the model in which Node 1 is more heavily weighted towards entering users than other nodes. This results in a net gain of umbrellas due to entering users depositing their umbrellas. These users then pick up umbrellas from a different node when they leave, resulting in a net loss of umbrellas from other related nodes. There are three ways with which we can resolve this issue: increase the upkeep cost of the system in order to account for labor costs involved in moving umbrellas around, ignore the issue and allow traffic flow to adjust to imbalances in the system, or selectively place units such that there is even flow across all units.
Another issue presented by the model is that of unequal flow with respect to time. As seen in the figure, users arrive on campus in stepped flow as would occur due to regularly scheduled meetings or classes. In order to accommodate these steps we will ensure that enough units are placed at a location as to provide for these peaks in flow. Alternatively, we could redesign the unit in order to increase its capacity; however, based on the modular nature of our system, this is unnecessary at this point.
One additional way to resolve the issue of increased initial investment and increased upkeep costs to combat the issued presented by our analysis is to offer our system as a service; charging customers a monthly fee for its implementation. This implementation would allow uniform control over umbrella distribution recycling and monitoring while removing the risk and some of the cost from the customer, making our system more appealing and cost effective.
Counter
Description
In addition to developing a model of traffic flow through various nodes, we also realized the limitations of the accuracy of such an analysis. As such, we felt it necessary to develop a system by which we could better track usage in an actual environment. We tested this methodology on an actual Campus, by monitoring entry and exit points on CMU's campus. We developed in-house counting software to facilitate our tracking on the campus flow patterns, and then used the output to plot flow patterns at a variety of locations and time intervals.
Software
In order to facilitate the counting of people through various doorways and locations, we developed software that allows us to capture time-stamped flow information using a laptop.
This software allows the user to press the 'i' key to record incoming people, and the 'o' key to record outgoing people. In each instance, the event is time-stamped so that we are able to plot the number entering or exiting a building as a function of time.
The software interface at start up includes a text field in which to enter the location at which you are recording:


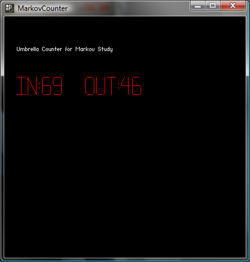
In this case, the output file would be named:
data_Building 1.txt
and the contents of the file would resemble:
Recording at Building 1
Logging started at: 11.38.54.7370 on 11/7/2008
Time: 11.38.55.8245;	In: 0;	Out: 1
Time: 11.39.2.15508;	In: 1;	Out: 1
Time: 11.39.6.19423;	In: 2;	Out: 1
.
.
.
Time: 11.44.28.341333;	In: 13;	Out: 5
Extensions
One of the unfortunate things about our developed software is that someone from our team must be present during the whole session, and must constantly be entering data into the program. While this is acceptable for a small number of short studies, the correct implementation of an actual system might require more extensive surveying. To do this it is unreasonable to ask a team of people to perform a similar analysis. In light of this, the options are to either over-estimate the number of umbrellas needed at a location and monitor usage after the system has been implemented, or to provide an automated system capable of performing the counting on its own. It is the implementation of this latter system which this section will describe, since it would be necessary to perform any extensive analysis of this type in the future.
An automated counting system consists of two parts, motion detection, and person recognition. In the ideal system a computer would be hooked up to a camera monitoring a specific entryway. Once a person enters through the entryway, the camera would detect the motion and capture the frames for further recognition. After relevant video frames are captured, you can use blob detection or face recognition to count the number of people. Our team has implemented a rudimentary motion capture system and has the ability to use it to do remote flow pattern counting in a systematic way as described above.
The system works through the concept of frame-differencing, by which two successive frames in a video are subtracted from one another. This shows only the areas of the video which are moving, thus indicating objects. Our system works by performing frame differencing and only logging video in which significant portions of the video are moving, allowing us to capture only portions of the video that require our attention. An example of this technique is shown below:
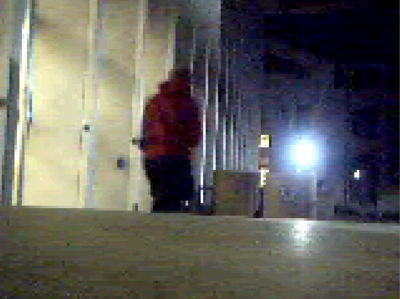
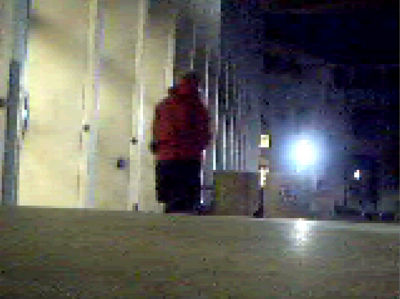
The subtracted result clearly identified the moving portion of the image, notably the moving person and the closing door behind them.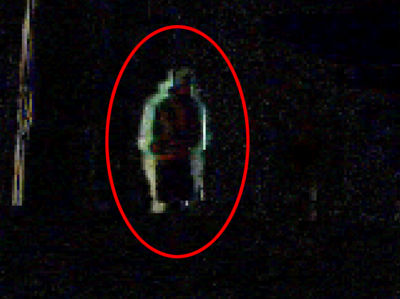
With this video, we can then run a similar counting analysis manually allowing us to collect the data in much faster time. Further improvements would detect features automatically so that manual counting would not be necessary.
Results
The following plots show the in-and-out traffic flow at different locations of campus buildings.
- Doherty Hall upper entrance
The data at Doherty Hall entrance were taken for approximately 30 mins, starting from 13:14pm.
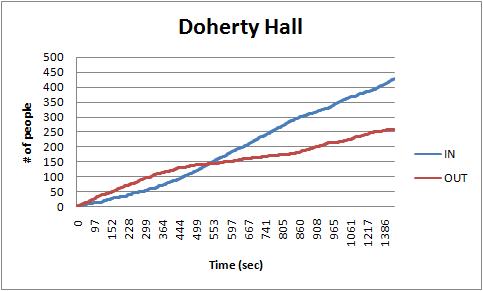
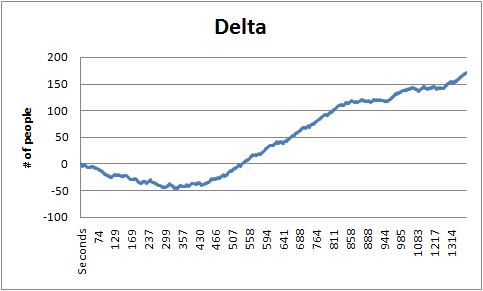
The plot on the left side shows the incoming and outgoing traffic flow at the entrance. There were more outgoing flow than incoming flow at the beginning but incoming traffic increased gradually and ended up exceeding the outgoing traffic flow in 30 min. Also, according to the plot on the right side, Delta (incoming traffic flow - outgoing traffic flow) gradually increased and reached up to 171 at the end.
- Baker Hall entrance
The data at Baker Hall entrance were taken for approximately 30 mins, starting from 12:17pm.
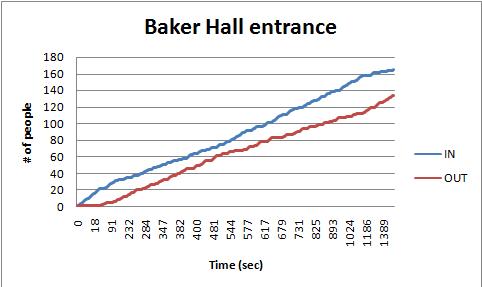
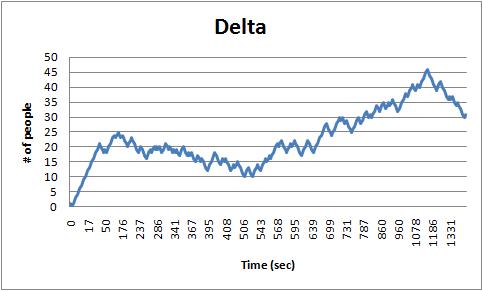
The in-and-out traffic flow plot show that there were more people going into the building than those coming out of the building and this trend was kept over the whole experiment. Also, the Delta plot on the right side indicates that the maximum Delta value reached up to 47.
- Porter Hall entrance
The data at Porter Hall entrance were taken for approximately 1 hr 30 mins, starting from 11:08am.
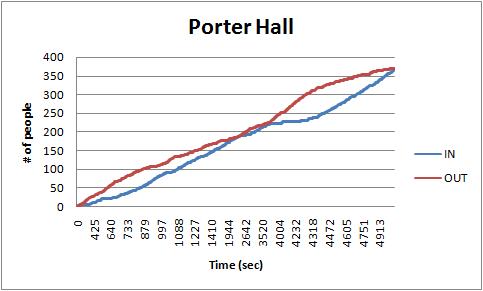
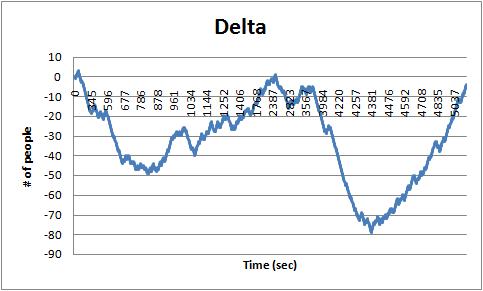
Overall, there were more people going out of the building than those coming into the building over the time period of the experiment but the incoming and outgoing flows evened out around 2365 seconds and at the end. The minimum delta value observed at the entrance was -79.
- Newell-Simon Hall entrance
The data at Newell-Simon Hall entrance were taken for approximately 50 mins, starting from 11:41am.
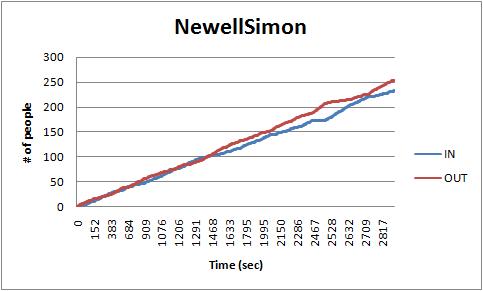
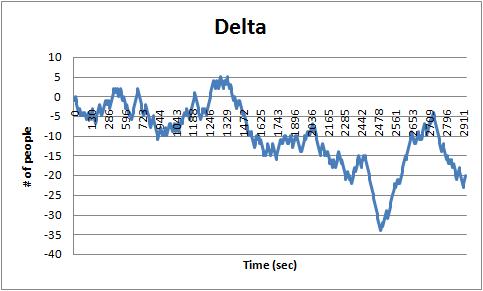
Overall, there were more outgoing traffic flow than incoming traffic flow at Newell-Simon Hall entrance. Thus, the delta value has decreasing trend. According to the delta plot on the right side, the minimum delta value observed at the entrance was -34 around 2530 seconds from the beginning.
- Wean Hall entrance
The data at Wean Hall entrance were taken for approximately 50 mins, starting from 11:13am.
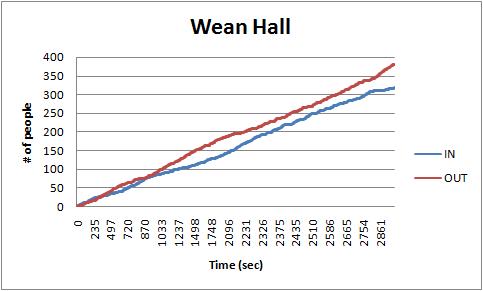
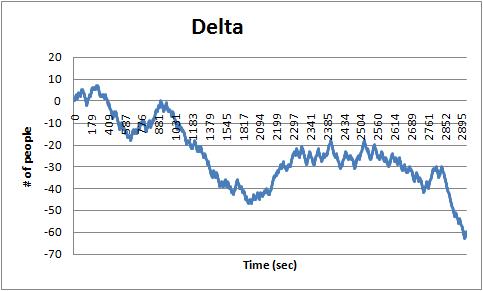
The in-and-out traffic flow plot on the right shows that there were usually more people coming out of the building than going into the building over the time period of the experiment. According to the delta plot on the right side, the minimum delta value observed at the entrance was -63 at the end.
- University Center Revolving door
The data at UC Revolving door were taken for approximately 50 mins, starting from 11:00am.
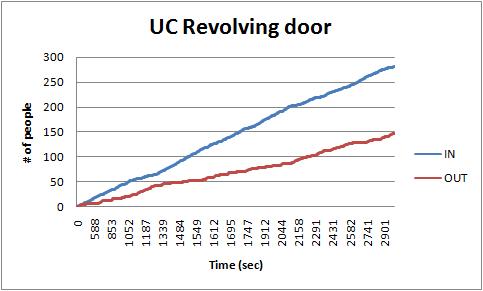
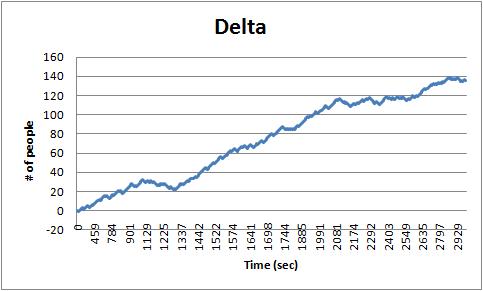
The incoming traffic flow gradually increased compared to the outgoing traffic flow at the UC Revolving door. Thus, the delta value of the plot on the right side has a increasing trend and the maximum value of delta turned out to be 139 around 2864 seconds from the beginning.
Conclusions
After running the Markov Analysis and concluding the campus counting studies, we have drawn the following conclusions:
At certain locations on campus there seem to exist various sinks and sources of umbrellas. These locations either have a higher influx of people than outflux, creating a constantly increasing collection of umbrellas, or vice versa. Sink and source behavior is seen both in the Markov analysis as well as the measured data from campus. This presents a problem in the system as the total capacity of umbrellas at those locations will have to be larger than normal to account for the sink/source behavior. Also, the system may not be able to be left unattended over long periods of time, otherwise certain locations may be left with no umbrellas. This may necessitate some sort of umbrella-moving system, whereby a maintenance worker may have to move modules around campus. Labor charges for this could potentially prove to be costly in the long run. Another option would be to strategically place the dispenser modules in areas that promote equal traffic flow in the hopes that this would eliminate the issue.
Our two methods of analysis have indicated the difficulty and expense of performing detailed traffic flow. Both the Markov model and measured data suffer from limitations in the amount of accurate data that is used from predictions. In order to counter this, more detailed measurement of the traffic flow on campus must be conducted, which bears both material and time costs for our team.
Our conclusion from this is that it would be most cost-effective to overpopulate the umbrella system at first, giving a larger number of umbrellas to each of the locations and monitoring the usage over time. Over the first week or two of usage, the troublesome points on campus would become evident. This could be easily tracked by noting the key card transactions with each unit over time.
From the analysis conducted, the following entryways on campus are listed in order of descending needed capacity for umbrellas (i.e. they have the largest umbrella "flux" on campus):
Doherty
University Center
Porter
Baker
Wean
Newell Simon
Others (negligible)
